Active U.S. derivatives
The Titan and Sidereal Volatility strategies
Objective
These strategies are designed to grow assets when equity market volatility is stable or falling and to protect assets when volatility is high or rising.
They are designed to generate returns by exploiting inefficiencies in the equity index volatility futures market, which has historically mis-priced the risk of near-term equity market moves.
Titan and Sidereal both dynamically short the VXX volatility futures ETN. They increase or reduce exposure based on our proprietary Derivative Market Stress risk management decision engine, to improve risk-adjusted returns relative to maintaining constant levered short volatility exposure.
Titan is designed to give maximum exposure to this approach, and often applies some leverage to the short volatility exposure.
Sidereal gives less exposure to the approach, and couples it with long US Treasuries exposure in order to reduce day-to-day fluctuations (US Treasury bond prices tend to move inversely to US equity prices and to covary with volatility).
Our Proprietary Investment System
Our proprietary Derivative Market Stress decision engine uses insights into volatility market dynamics derived from well-known academic research, augmented with Huygens’s own research.
When multiple metrics all suggest equity volatility should fall or remain stable, volatility is shorted with varying exposure. If any of the metrics contradicts this view, assets are moved to cash.
The indicator system is updated once each day, after market close. Portfolio repositioning, if required, is effected the next business day, allowing us to respond quickly to changing market conditions.
Active U.S. smart beta equities
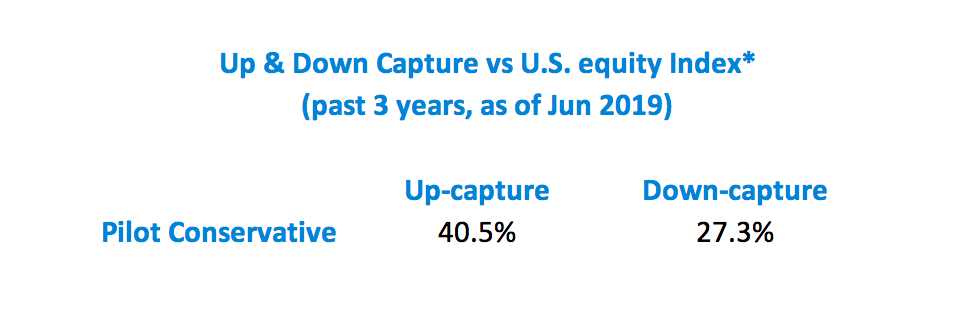
The Pilot Conservative Tactical Growth & Income Strategy
Objective
The strategy is designed to grow assets during both rising and steeply falling U.S. equity market regimes. Our approach is to shift between offensive and defensive portfolios of ETFs in response to our proprietary measures of market stress.
During low-stress periods, the strategy gives exposure to an income and growth portfolio via highly liquid U.S. government bond and smart-beta equity index ETFs. When equity market stress rises, we reposition the portfolio to reduce equity exposure and increase bond exposure.
We offer clients daily liquidity and full transparency by providing our strategies in separately managed accounts.
Our Proprietary Investment System
Our proprietary Equity Market Stress risk management decision engine incorporates insights into behavioral finance and equity market dynamics learned from well-known academic research, augmented with Huygens’s own research. Our system is a data-driven tool for identifying and reacting to periods of market stress, and resulting changes in short-term investment outcome likelihoods.
Indicator State
Offense
Defense
Implication
Bullish equity market sentiment prevailing; lower than average risk of large declines
Market stress rising; higher than average risk of large declines
Our indicator is updated once each day, after market close, allowing us to respond quickly to changing market conditions. Any portfolio repositioning required is effected the next day.
Want to learn more? Let us know by sending us this form and our Director of Sales will connect with you with more information.
*Important notes:
Actual performance shown for Pilot Conservative strategy reflects client account and proprietary account performance, both of which reflect the pro-forma impact of 1.25% management fee
The Pilot Conservative strategy’s offense positioning composition was changed as of April 1st, 2019.
Before this date, the offense portfolio consisted of IWM (the Russell 2000 small cap index ETF), SPLV (the low volatility U.S. stock ETF), and IEF (the 10-year U.S. treasury ETF).
After this date, MTUM - the MSCI US Momentum stock index ETF - replaces the portion of the portfolio previously occupied by IWM. Our rationale for making this change is described in our Aug 3rd 2019 blog post
The MSCI US Momentum stock index is a Smart Beta index (read more about that here) that re-selects and weights its constituents every 6 months, starting from a population of all US large and mid-size publicly traded companies
Therefore, the equity index return shown for comparison is a composite of the Russell 2000 small-cap index (for the period July 2014 through March 2019) and the Russell 1000 large-cap and mid-cap stock index (for all periods after March 2019).

