The power of losing less

We won’t take you on a trip down memory lane to relive the first half of 2020.  It was rough and scary for everyone.  Instead we’ll share with you the good news of how our clients fared.  

Simply put, Huygens’s combination of active risk management and smart beta portfolio construction helped our clients avoid much of this year’s volatility, and put them well ahead of the broad U.S. equity market*. 

Consider our active equity portfolios.  The chart below shows the net asset value of our most conservative active equity portfolio vs the U.S. equity index benchmark* over the past two years.

Screen Shotted from PDF - Active Equities Cap Pres Aug 18 thru Jul 20.png

Our equity market stress signal was bullish in the start of the year.  It turned bearish on February 24th, repositioning our clients’ portfolios to overweight U.S. treasuries and underweight stocks.  It held that state during all of March and most of April as stocks sold off steeply, bottomed, and began recovering.  Our signal switched back to bullish in late April, repositioning our clients’ portfolios to capture gains from stocks’ recovery, and it held there through July.

The result has been that in the two years from August 2018 through July 2020, avoiding volatility has enabled this portfolio to deliver 7 times as much return per unit of volatility as U.S. stocks*.  Its worst monthly loss was less than a third that of the U.S. equity index*, yet this portfolio delivered 10% more total return.

This is the heart of the Huygens investment approach: Our system for active risk management is designed to enable you to earn more total return by losing less.

*See our active equity portfolios page for more information.

Latest stock market highs driven by Federal Reserve's return to quantitative easing

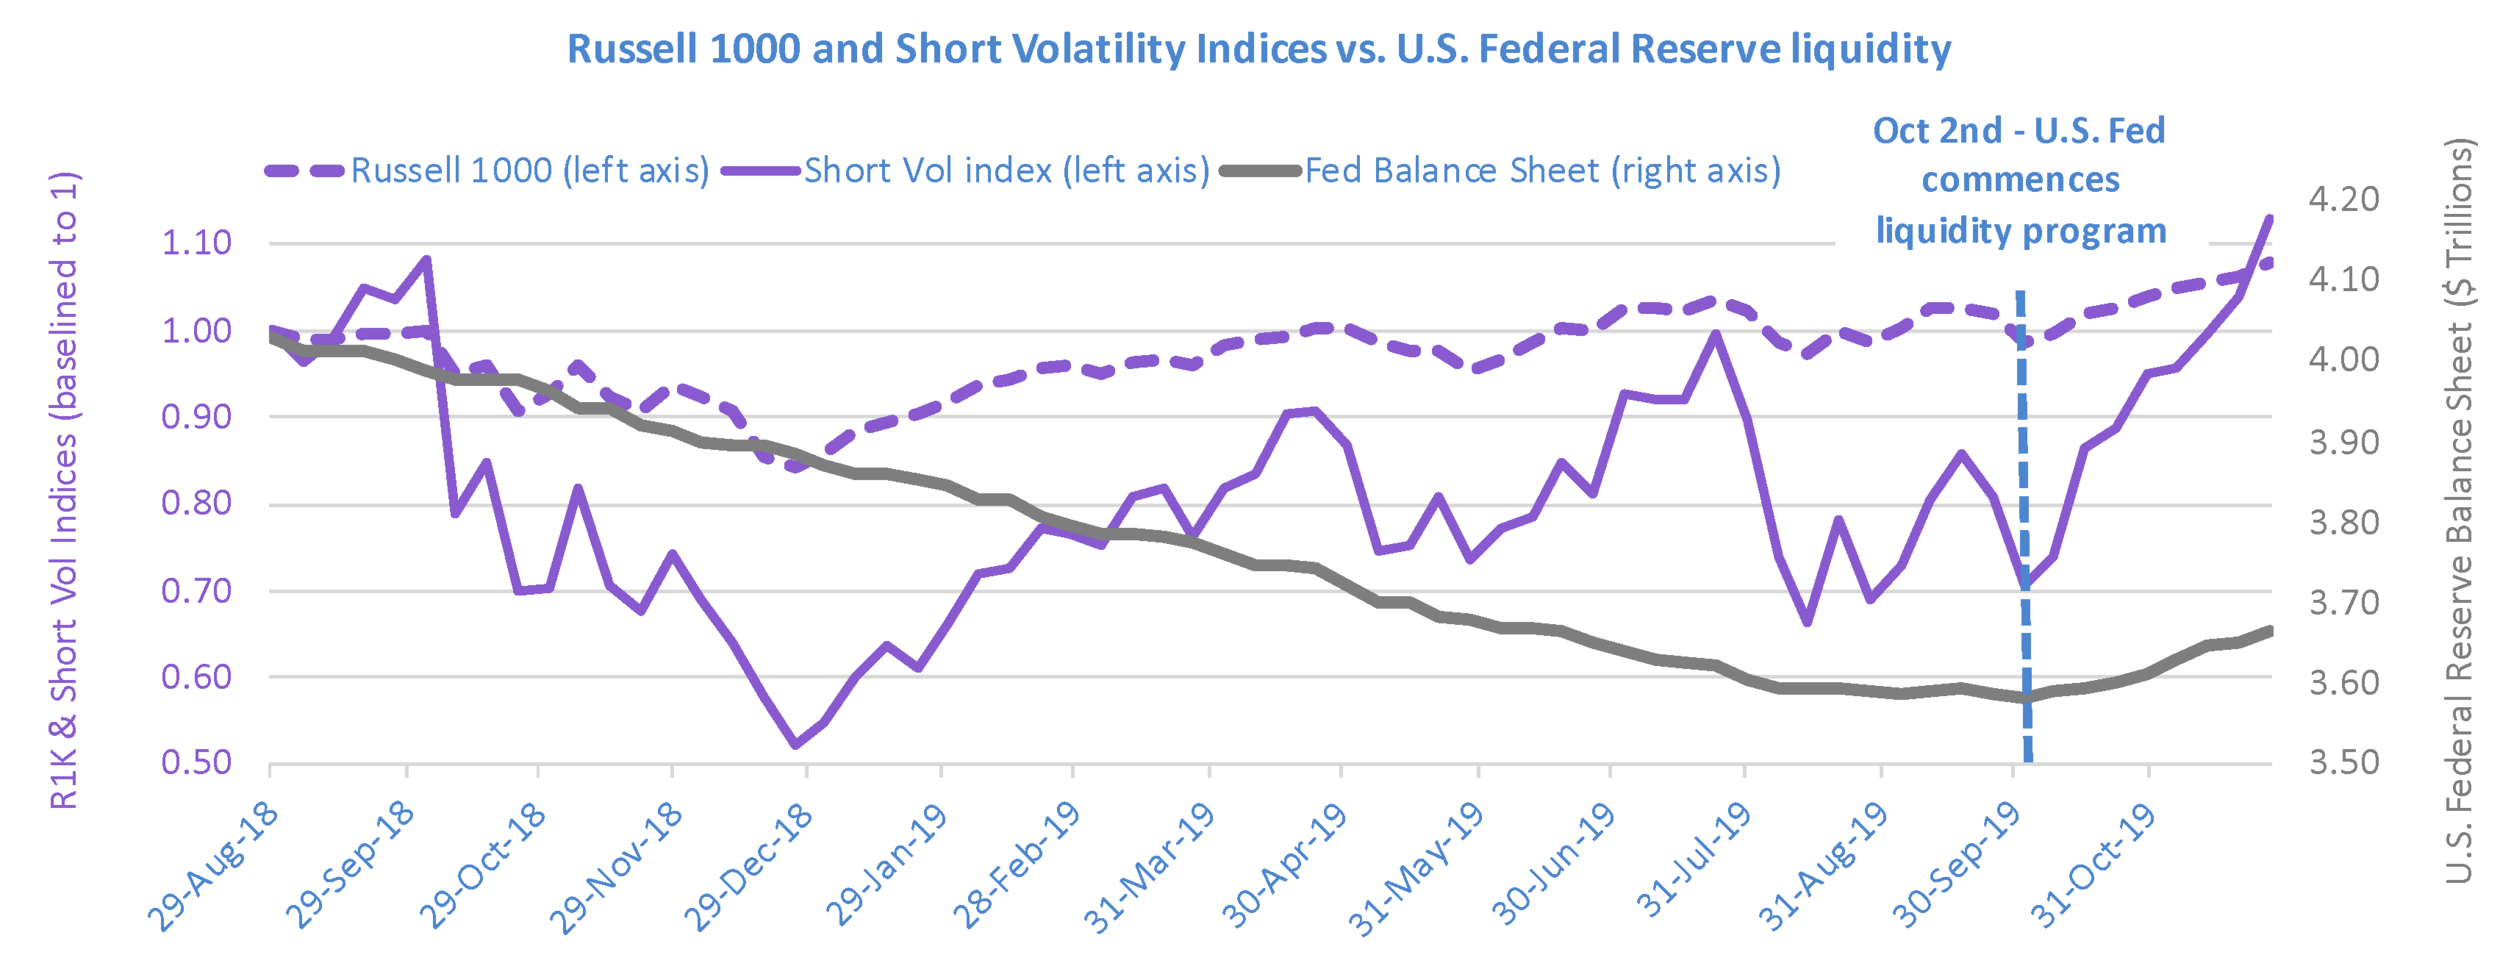
You may recall our analysis (click here to read it) demonstrating that nearly all U.S. stock market gains in the decade 2009 - 2018 occurred during periods of Federal Reserve economic stimulus. Have you noticed that since early October stocks have been on a steady march higher, with the U.S. indices all making new record highs? It’s not a coincidence. The Federal Reserve has begun stimulating the economy again, with a new $60B per month liquidity program launched on Oct 2nd but announced a week later (this New York Times article describes it). They’re not calling it “Quantitative Easing,” but mechanically it is the same, with the same impact on the economy and stocks.

Looking at the chart below, you may be startled to see that despite the very strong run stocks had in 2019 prior to October 2nd, the Russell 1000 stock index was still down 2% from its previous high in August of 2018. Similarly, volatility bursts persisted through 2019, keeping the Short Volatility index from progressing higher. It took this new Fed liquidity to quiet down volatility and enable stocks to push higher.

This program will continue through March of 2020, injecting into the U.S. economy $60 billion or more new liquidity per month. History suggests that investors will benefit.

20191204 Securities held outright vs R1K and Short Vol Index.png

Looking back on our active investment strategies over the past 12 months

The past 12 months have been confusing and likely disappointing for most investors. We’re still in the midst of the longest period in history without a 20%+ S&P 500 drawdown, so it’s natural to worry that another one might be imminent. That underlying anxiety has been reflected in the U.S. equity market’s periodic bursts of volatility since September of last year.

You probably feel some of that anxiety yourself, but don’t have the time or inclination to decide how best to navigate through it. That’s why you’ve hired us. Our active investing portfolios were designed for times like the past year, to give our clients exposure to equities and derivatives and to help them avoid the losses that can result from equity market volatility. Take a look at the below charts to see how we’ve delivered on that mission.

Pilot Cons NAV Past 12 Mo.png

Our active equities portfolios are well ahead of the Russell 1000 and Russell 2000 index to which we compare them (click here for more detail on these indices), as shown in the above chart of our most conservative active equities portfolio.

Titan NAV Past 12 Mo.png
Sidereal NAV Past 12 Mo.png

Our Titan and Sidereal active derivatives strategies are also well ahead of their comparison index, the S&P Short VIX futures index, or simply the Short Volatility Index, which on September 30th was down more than 20% from a year earlier.

Volatility bursts such as those of the past 12 months don’t generally allow for sustainable gains to be earned in equities or in VRP harvesting. That’s why our strategies are designed to identify the bursts as early as possible and wait them out.

China trade war headlines drove a volatile, whiplash August

Our strategies are designed to protect against two types of investment risk:

Headline risk: Same-day stock market response to a news item with implications for equity investors

Economic risk: Longer-term deterioration in economic activity or outlook that can impact equity market fundamentals and investor sentiment

Headline risk arises quickly and can dissipate quickly, while economic risk takes longer to reveal itself clearly and lasts longer with more severe impact. In August, trade-related headline risk emerged on three occasions, and dissipated quickly each time.

Analysts at JP Morgan and BofA noticed this and analyzed the daily market impact of the most prominent source of the headlines, President Trump’s tweets. The bottom line: his Tweets have significant market impact. Read more here: JP Morgan creates index to track Trump tweet impact; Bank of America: On days when Trump tweets a lot, stock market falls

Our investment strategies use portfolio composition designed to protect against headline risk, and use our volatility prediction & market stress indicators to switch to bearish positioning designed to protect when real economic risk emerges.

Because of the magnitude of August’s equity market responses to the trade-related headlines, both of our stress indicators switched to bearish positioning. Our equity market stress indicator switched back to bullish each time the headline risk dissipated; our derivative market stress indicator stayed bearish throughout the month, as shown below.

190916 Derivs indicator vs Short Vol Index.png

The outcome in August for our active derivatives portfolios is that they avoided most of the month’s drawdown and volatility.

Frequent bullish - bearish reversals such as those in August are the most challenging environment for our active equity portfolios. Our Capital Preservation portfolio, which is designed with the most cushion against headline risk, outperformed the Russell 1000 index in August. But our Moderate and Aggressive portfolios, which have less of that protection, underperformed it.

Huygens derivative market stress indicator helps protect against trade war related volatility bursts

In 2019 the volatility environment for our active derivatives portfolios (also known as our ‘short volatility’ portfolios) has rotated between two states:

  • Benign volatility as the U.S. economy continues to defy recession expectations and churns out steady, moderate growth - a very good scenario for harvesting volatility risk premium the way we do.

  • Bursts of volatility as surprise escalations of the U.S. - China trade war inject uncertainty into expectations for the future of the economy - a scenario which can quickly cause our derivative market stress indicator to turn bearish and wait for the volatility environment to improve.

In a previous post we described the gains our portfolios delivered in early 2019, after our derivative market stress indicator turned bullish in late January. The first of 2019’s surprise China trade war escalations came in May and hurt returns in that month before causing our portfolios to turn bearish until late June.

In June, volatility turned benign again and our portfolios were back to bullish and harvesting volatility risk premium. Then on July 31st, the U.S. Federal Reserve lowered interest rates as well as terminated early its balance sheet reduction program, known as quantitative tightening. The announcement linked the moves to providing the U.S. economy ‘insurance’ against future uncertainty, and this was generally interpreted as being linked to the ongoing U.S. - China trade war.

U.S. equity investors didn’t take the news well that day, perhaps anticipating that this would give the U.S. administration the green light to escalate the trade war. Our indicator turned bearish as a result, and our active derivatives portfolios exited the short volatility position at market close on August 1st.

That same day, the U.S. did indeed escalate the trade war with an announcement of new tariffs, and over the weekend China immediately responded by halting U.S. agricultural purchases and devaluing its currency. This drove a further volatility burst on Monday August 5th.

The below charts show the two short volatility indices that our active derivatives portfolios trade. When our portfolios are in the bullish positioning, they gain in value as these indices increase in value. On these charts we point out the days on which the trade war escalations were announced. The color coding of the lines also shows what was the state of our derivative market stress indicator at the time.

Mid-term volatility ETF (ticker: ZIV) traded by our robo-advisor active derivative portfolios

Signal vs ZIV ETF.png


Short-term short volatility index traded by our Titan and Sidereal short volatility portfolios

Signal vs Short Vol Index.png


At the moment, our indicator remains bearish, and due to its design will remain in that state for at least several more days.

One final observation - the early termination of the Federal Reserve’s quantitative tightening program could be quite significant and positive for the U.S. economy, stocks, and the volatility regime. Read here for our analysis of the impact quantitative easing and tightening have had on stocks.


How have our active equity portfolios performed over the past 9 months of stock market volatility? Quite well...

The first half of 2019 is a typical example of how our active portfolios can protect investors from behavioral biases that keep them from capturing stocks’ gains. 

Recall the situation coming into the year. During the brutal selloff of 2018’s 4th quarter, the Huygens equity market stress indicator was bearish for 54% of the trading days. All the financial news was bad. It was frightening:

Given the turmoil, investors might have been tempted to exit all stock exposure to wait for clear signs that the economy has strengthened before getting back in. 

Anyone doing that in 2019 missed a remarkable run and instead just locked in losses.  The signs of strength didn’t come until after most of the gains had been earned – as is usually the case. In January, there was no all-clear signal in the news as headlines stayed bleak:

Even so, the S&P 500 gained +7.9% in January.  The Huygens equity market stress indicator turned bullish within the first 5 trading days of the year, and as a result the most conservative Huygens active equity portfolio gained +3.7% while the most aggressive gained +5.6%.

In the months of February thru April 2019, economic news was mixed. An investor seeking unequivocal evidence of a strengthening economy still didn’t get it during these months, but equities kept recovering.  The S&P 500 gained 8.9% from February through April, and because our equity market stress indicator stayed bullish throughout, our conservative active equity portfolio was up 5.0% and our most aggressive was up 6.7% in the same period.

Then came May.  Headlines in the early part of the month finally made it clear that the previously expected 2019 recession had been averted:

But by the end of the month, news had turned sour again:

And the S&P 500 fell -6.6% in the month.  Our active equity portfolio composition protected against much of these losses: our conservative portfolio clients lost only -0.5%, while those in our aggressive portfolio lost only -2.1%.

Once again, an investor might have taken May’s selloff as a sign the economy was really faltering this time, and again this would have been a mistake. Our equity market stress indicator stayed bullish throughout, positioning our active portfolios to capitalize on the gains that were to come in June as the S&P 500 established a new high.

The industry-standard way to assess the benefits of an active strategy such as ours is a metric called “capture.” Up-capture measures how much of an index’s gains our strategy delivered, and down-capture measures how much of that index’s losses our strategy gave up.

The below table shows that over the past nine months (Oct 2018 thru Jun 2019) of heightened stock market volatility, all three of our active equity portfolios delivered much more of the upside than the downside of the equity indices they actively trade (click here for comprehensive performance tables and index descriptions):

*Past performance is not necessarily indicative of future results

*Past performance is not necessarily indicative of future results

Enhancing our active equity portfolios: Bye bye small cap stocks, hello momentum stocks

Starting April 1st of this year, we replaced US small cap stock exposure in our active equities portfolios with US momentum stock exposure. We did this because small, fast-growing, vibrant companies are choosing to stay privately owned rather than publicly listing their shares. In addition, internet business models have created a “winner-take-all” dynamic in many segments of the economy. As a result, we believe momentum stock exposure is better than small company stock exposure for capturing returns during periods of low stock market stress. More details below.


MTUM IWM SPY.png


Exploiting equity factors to capture maximum risk-adjusted returns for our clients is a core element of our investment approach.  You can read more here on how we use factors in our portfolios.

We originally designed our active equity portfolios to seek small cap US equity exposure via the Russell 2000 index ETF (IWM) in times of low equity market stress, as determined by our equity market stress indicator.

The relative outperformance of smaller companies over many decades has been heavily studied in the investing industry literature, and it has been generally attributed to small companies’ better growth opportunities combined with their comparative obscurity. If fewer investors have researched these companies, the rationale goes, there is better opportunity for a smart investor to buy their shares at a good price before other investors catch on.

Over the past few years, the strength of the small cap factor has been shown to be weakening - this Research Affiliates study and this Wall Street Journal article both give a nice overview.

Moreover, the U.S. equity market has changed dramatically in the past decade, and one of the biggest changes has been the shrinking population of publicly-traded small-cap companies - read more on that in this Vanguard research note. There are still plenty of small companies, they’re just not going public anymore to fund their growth - read more on that here. Instead, they’re choosing to stay privately held because they’re finding it easier to raise financing in the ever-expanding private capital market, as described in this McKinsey report. For an excellent first-hand account of this phenomenon, read “Why so few of our companies aspire to go public” by SSM Partners, a growth private equity firm focused on smaller companies.

In addition, the winner-take-all dynamic driven by companies like Amazon, Google, Netflix, and other internet-centric businesses, described in this New Yorker article, means that growth is accruing to fewer and fewer of the remaining publicly-traded companies. This dynamic favors ‘momentum’ companies – those whose recent stock price performance has been better than average.

The above chart shows how big the performance difference has been between small cap stocks and momentum stocks. In the past 5 years, the MSCI momentum stock index ETF (MTUM) has delivered nearly 2x the return of the broad S&P 500 index ETF, and nearly 3x the return of the Russell 2000 small cap index ETF.

Momentum companies’ outperformance relative to the broader population of publicly traded companies isn’t a new phenomenon. MSCI publishes the US momentum stock index that our portfolios use via the MTUM ETF, and their research shows this to have been true for decades. But momentum’s outperformance relative to small caps is stronger than ever, and we believe this will persist into the future.

Derivative market stress abated in first 5 months of 2019, driving gains for short volatility investors

Back in 2018, US market equity market volatility caused our derivative market stress indicator to signal bearish positioning for 61% of the year. For a quick reminder of what was behind 2018’s volatility, take a look at this post. This means that our dynamic derivatives clients’ assets spent most of 2018 in cash or 10-year US treasuries, waiting patiently and safely for better opportunities to emerge.

The first 5 months of 2019 has shaped up to be a time of better opportunities. As the recession scare of Q4 2018 wore off, subdued volatility in equity and derivative markets has driven our derivative market stress indicator to signal bullish positioning for 66% of this year, through the month of May. The difference in short volatility conditions, and in the positioning of our indicator, is evident in the chart below.

*Past performance is not necessarily indicative of future results

*Past performance is not necessarily indicative of future results

Early May saw a surprising return of volatility - surprising because after months of headlines signaling positive developments in international trade negotiations with China, over the May 4th-5th weekend the US announced that the tariffs against Chinese imports would be levied after all, and that negotiations were headed nowhere. Our derivatives market stress indicator quickly turned bearish, and as a result our dynamic derivatives clients spent the rest of May in cash or US treasuries (depending on the strategy).

Government stimulus drove almost all of past 10 years’ S&P 500 gains

You’ve probably seen a chart like this one, showing the striking relationship of the S&P 500’s gains in the past decade to Federal Reserve stimulus phases 1, 2, and 3, known as ‘quantitative easing.’ But perhaps you’ve wondered if that relationship is just a coincidence.

Well, the fourth quarter of 2018 made clear it’s no coincidence.

S&P 500 and Fed Bal Sheet over time.png

We’ve marked periods on the above chart as easing, pause, and tightening, corresponding to whether the Federal Reserve was putting money into the economy, standing pat, or taking money out. Note we’ve also marked the ‘Tax Stimulus’ period, in which government economic stimulus was being applied, but not by the Fed.

Then we graphed these periods by average S&P 500 weekly return in each period vs. the amount of money each week the Fed injected into (or took out of) the economy in that same period, and ran a regression.

S&P 500 vs Fed Stimulus.png

What’s clear is that Federal Reserve stimulus drove most of the S&P 500’s gains over the past 10 years, and tax cut stimulus drove the rest. With an R-squared of 93%, data scientists call this sort of relationship a slam dunk. Rarely is such correlation between cause and effect found in the real world.

Now that the Federal Reserve is unwinding its balance sheet and is reluctant to lower interest rates, what does this mean? Sustainable gains in equities are becoming more elusive, and protecting against volatility will be critical.


Derivative market stress indicator protects our dynamic derivatives clients from much of 4th quarter 2018 volatility

The short volatility asset class generally experiences its best returns when the outlook for US stocks is improving or static, as occurred in 2017 with a rebound in GDP growth and the passage of the Trump federal tax break (click here to read more about that in a previous post).  

It generally experiences its worst returns when the outlook for US stocks is deteriorating, as occurred in Q1 2018 with trade war talk coinciding with the arrival of a new hawkish Federal Reserve chairman, worrying investors that inflation and tight money might all be coming quickly (click here to read more about that in a previous post).

It happened again more severely in the 4th quarter of 2018. While headlines were focusing on investor fears of recession, we think the real driver of stock market volatility was the unwinding of the Federal Reserve's balance sheet (click here to see the analysis we later shared on this point).

The chart below shows how our derivative market stress indicator helped our dynamic derivatives portfolios avoid most of the 4th quarter’s volatility. Our Titan strategy avoided more than 2/3 of the short volatility index’s decline.

*Past performance is not necessarily indicative of future results

*Past performance is not necessarily indicative of future results


Arrival of Hawkish Central Bank leadership in first half of 2018 is increasing volatility and competing with earnings growth to drive stocks’ direction

Recall that in early February of 2018, there was a brief burst of intense equity market drama.  The arrival of a new, potentially more hawkish US Central Bank chairman coincided to the day with an unexpectedly strong US employment report. These circumstances implied that a more aggressive Central Bank interest rate path was in the offing, causing a rapid but limited equity market selloff, and an accompanying increase in daily volatility that lingered for many weeks. 

By contrast, the second quarter was relatively quiet for our strategy.  In April, due to ongoing volatility from the first quarter, our indicator kept our clients defensively positioned for the first two weeks of the month, incurring some small losses.  But in May and June our indicator signaled a return to offensive exposure to equities, driving gains in both months.  In the final week of June, a Trump administration announcement of trade tariffs on $200B of imported Chinese goods led to a brief selloff in equities that reduced our gains in the month, but it wasn’t enough to switch our indicator back to defensive.

Outlook

When geopolitical news or Fed chairman turnover drives short-term stock volatility despite robust company earnings growth, as was the case in the first half of 2018, it generally is due to professional investors’ macroeconomic rules for predicting company valuations.  For example, more rapid interest rate increases by a hawkish Federal Reserve can imply that money supply across the economy could decrease, reducing consumer spending and company borrowing.  New trade tariffs on Chinese goods can imply that a trade war with China could reduce U.S. company exports, and could increase costs for items manufactured in the U.S. from Chinese components.

This sort of news-driven heuristic is currently competing with the upward stock price pressure of earnings growth. According to Thomson Reuters, S&P 500 earnings grew in the second quarter of 2018 by a remarkable 22.6% from the same quarter a year ago. Another heuristic competing with strong earnings growth is the potential impact of an inverted yield curve:

Schwab inverted yield curve.png

Source: Charles Schwab & Co.

The plot shown here is of the interest rate difference between 10-year and 2-year US government bonds.  As the Federal Reserve raises interest rates during a typical economic expansion, it eventually pushes 2-year interest rates higher than the interest rate on 10-year bonds, causing a negative difference between the two rates, resulting in an ‘inverted’ yield curve.

The chart demonstrates that such a condition has preceded every U.S. recession since the 1970s, albeit with significantly varying time lag in each case.  For instance, the 10-year to 2-year yield spread fell below 50 bps in early 1995, a full six years before the 2001 onset of a recession and bear market in U.S. equities.  An investor using the yield curve’s breach of this threshold as a signal to get defensive would have missed out on the remarkable returns of the 1995-2000 period and would have waited nearly a decade for the decision to pay off.

While the U.S. economy’s expansion continues to mature and approach an eventual correction, our analyses have shown us that when it comes to identifying periods to be offensively or defensively positioned to U.S. equities, our indicator system is better positioned to do so than any macro-economic heuristics such as those mentioned above.  So as various news items continue to drive brief periods of volatility while S&P 500 earnings growth powers on, we’ll continue to use our indicator system to position your assets to benefit from potential equity gains and to protect against potential losses.

Derivative market stress indicator protects our dynamic derivatives clients from most of February 2018 volatility

Note: this client note has been edited since it was originally sent to our clients in 2018, in order to clarify language related to our dynamic derivatives portfolios

Our derivative market stress indicator is designed to bullishly position our dynamic derivatives portfolios only when conditions are consistent with the likelihood of positive returns and a reduced probability of steep losses.  In general it has us bullish (that is, shorting volatility) when equity market volatility is relatively high but declining, and bearish when equity markets are abnormally calm or becoming more volatile.

The first quarter of 2018 brought a sharp transition from a very low volatility equity market regime to one of above average volatility.  To us it was a transition from a regime in which it was difficult to profit in derivatives without taking undue risk, to one in which we expect shorting volatility to be profitable again with an acceptable risk profile. 

Our system is designed to avoid much of the steep potential short volatility losses during such a transition.  In the first quarter our Titan strategy avoided 84% of the losses incurred by the VIX Short Term Futures Inverse Index.  The index suffered its worst losses in the quarter on three separates instances in which the VIX index jumped by more than 25% in one day; our derivative market stress indicator had our client assets protected in cash for all three.

Our previous Titan client note was sent out on February 1st of this year.  Coincidentally, the Titan system had just moved our clients’ assets to cash on January 29th.  The note reflected on the eerie calm prevailing in equity markets. The very next day after we sent that note, Jerome Powell arrived as the new Federal Reserve chairman, and the Bureau of Labor Statistics released an unexpectedly strong employment & wage report. 

Those two relatively innocuous items combined to make it evident the Federal Reserve would likely raise interest rates 4 times in 2018, setting in motion a rapid equity market selloff and accompanying volatility spike.  On Monday February 5th the S&P 500 index declined 4% from its Friday close, its largest close-to-close decline in over 6 years.  The VIX index (recall that the VIX is essentially a normalized price for equity downside risk insurance) increased by 116%, its largest one-day percentage change ever.   

The transition from low volatility to high volatility, which commenced January 26th and was complete by February 8th after delivering a cumulative 10.1% S&P decline, was remarkable partly because it came so quickly following the 7.4% S&P sprint higher in January. Over the last ninety years, equity price momentum has never exhibited such dramatic short-term deterioration. One World War, one Great Depression, thirteen other official recessions and various financial panics all did not generate the reversal in equity price action observed in the first 6 weeks of 2018.

Realized volatility remained elevated for the remainder of the quarter, with the February-March period registering annualized realized volatility of approximately 24%, double the non-recessionary volatility since 1990, and more in line with that observed in the recessions of 2001 and 2008-2009. A return to elevated levels of equity market volatility was to be expected, and is in fact necessary for our dynamic derivatives portfolios to have meaningful opportunity for profit in the future. So we welcome the first quarter’s reset to a higher, more typical level of volatility.

Dynamic derivatives strategy 2017 year in review

Note: this client note has been edited since it was originally sent to our clients in 2018, in order to clarify language related to our dynamic derivatives portfolios

2017 was the first full year in operation for our dynamic derivatives portfolios, and we are pleased to say that their actual performance was highly similar to the performance for which they were designed:

  • In 2017 they had bullish positioning (meaning exposure to the short VIX futures ETF position) on 125 of 251 trading days, and were in bearish positioning the rest of the time.  This was in line with our hypothetical model, which shows bullish positioning 45% of the time and bearish the remaining 55%

  • Our derivatives market stress indicator caused execution of 24 individual trades.  18 of these generated positive return, for a 75% batting average, which is somewhat better than our hypothetical model’s 66% winning trade batting average

  • Our Titan strategy's net annual return of 48.3% in 2017 is in line with our expected average annual return of ~50%, based on hypothetical backtesting

Our Titan dynamic derivatives strategy is designed to offer our clients a way to aggressively speculate in an asset class that is meaningfully different from traditional equities, fixed income, and commodities.  The industry term for Titan’s asset class is ‘volatility,’ but to us at Huygens it is more instructive to think of it in terms of insurance.  Titan takes advantage of a persistent mis-pricing of U.S. equity market insurance instruments, driven by large institutional equity portfolio managers’ (think Capital Research, Fidelity, AllianceBernstein, Franklin Templeton, in addition to large hedge fund firms) need to hedge their downside risk.  Because of the large amount of equity exposure being hedged, it is a particularly difficult pricing anomaly to arbitrage away.

We expect that all of our clients are well aware of the benign equity investment conditions prevalent in 2017, so we won’t discuss them here.  Instead we will focus on just the volatility of U.S. equity returns, because this is what drives Titan’s return generation process.

Both implied and realized volatility set new record lows in the US, dating to the creation of the VIX index in 1990.A few brief spikes of implied volatility did occur - on three occasions the VIX index increased more than 30% in a single day, during all of which the Titan strategy was in cash - but overall 2017 was utterly bereft of equity market swings.Below we highlight a few of the specific ways in which 2017 was out of the ordinary.

Before 2017, it was rare to see the VIX index close below 11.0.  In 2017 this occurred more times than in the prior 26-year history of the VIX Index combined; see chart below.  2017 recorded the lowest ever VIX Index average for a month (October: 10.1), a quarter (3Q: 10.3), and a year (11.1).

20190609 Days VIX below 11.png

Of course the VIX Index measures the price of insurance, as derived from the prices of options that reference the S&P 500 Index.  This insurance was so cheap because 2017 was also an extraordinary year for actual realized volatility.

20-day realized volatility - the standard convention when comparing to the VIX index - averaged 6.7 in 2017, dramatically below its average since 1990 of 15.7.  Sharp market moves were both small and rare in 2017.  In a typical year, the S&P 500 index will suffer a single day decline of more than 1% 30 times and of more than 2% nine times.  In 2017 there were four single-day selloffs of more than 1% and no declines greater than 2%.  Indeed, the single worst 2-day decline in 2017 was 1.9%.  The below chart shows historical levels of both implied and realized volatility, back to 1990:

20190609 VIX vs Realized.png

It should be noted that all of Titan’s 2017 gains were earned in the first quarter.  The ultra-low volatility conditions described above really took hold in the second quarter of 2017 and continued through year end, making equity downside insurance extremely cheap.  Because of the steep negative response of the VIX to small market perturbations at such low VIX levels, we deem the risk of an ugly reversal and steep losses in such conditions to be too high.  As a result our system, after enjoying the conditions of the first quarter, sat out much of the remainder of the year. 

Based on past history, the U.S. equity market won’t remain in such a low volatility state permanently.  And when volatility returns, our Titan strategy will be ready to capitalize on it for our clients.

Huygens equity market stress indicator stays on offense as economic strength continues

The story of the third quarter is very similar to that of the second quarter.  It stands out as an almost uniquely calm period for US equity markets. Consider:

  • In the 27 years from VIX index inception in 1990 through the second quarter of 2017, the VIX Index closed below 10 on 16 days.  In the third quarter of 2017 alone, the VIX Index closed below 10 on 17 additional days.  The quarter represents less than 1% of trading days in the past 27 years, but more than half of all sub-10 VIX closes.

  • The overall VIX Index average for the quarter was 10.94, the lowest in history.

  • One week in late September saw the S&P 500 move less than 0.5% (intraday peak to intraday trough), the tightest such one-week range since the 1970s

Placid periods for U.S. equity markets generally correlate to positive returns. The chart below plots Russell 2000 quarterly returns against prevailing average VIX levels in the same quarter. The large green data point at the leftmost end of the distribution represents the third quarter of 2017.

VIX vs total return.png

The chart demonstrates that when equity market volatility and implied volatility are this low, returns tend to be quite positive and narrowly distributed around the positive expected outcome.  As the average VIX level increases, the expected return falls, and the range of possible returns increases dramatically.  Those of you that check our market stress indicator regularly or receive our signal email weekly may have been wondering why it has remained in the offensive state since November of 2016.  The above chart hopefully makes the answer clear: with implied volatility this low, it is best to stay the course with equities and maintain full exposure.

Low equity market volatility generally results from positive investor sentiment regarding economic conditions.  The third quarter’s abnormally low volatility coincides with, and likely results partially from, an almost equally rare confluence of good employment news (all charts sourced from yardeni.com): 

  • Steady job creation has continued in 2017, with no sign of slowing

Source: Yardeni.com

Source: Yardeni.com

  • U-6 unemployment (which measures the unemployed plus those workers that are employed part-time for economic reasons) has returned to its pre-crisis level, indicating most workers displaced in the crisis have now found full-time employment

Source: Yardeni.com

Source: Yardeni.com

  • The ratio of job seekers to job openings is at its lowest level of the past 17 years

Source: Yardeni.com

Source: Yardeni.com

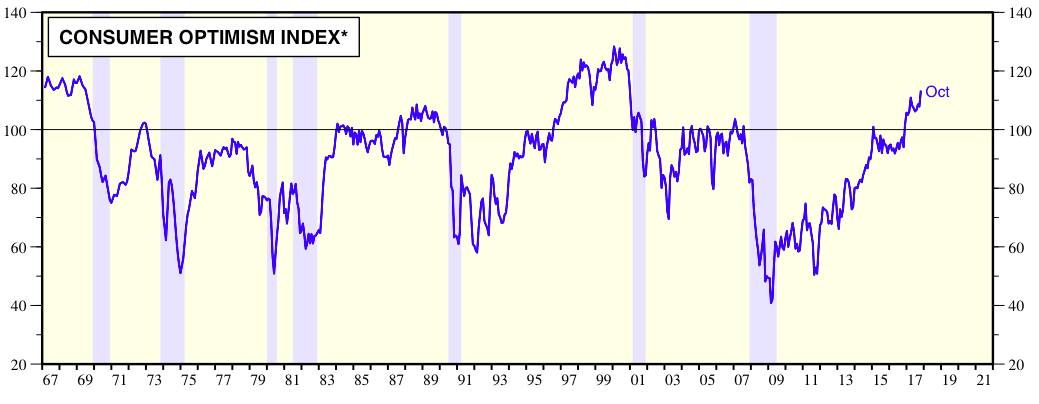
In such an employment environment, workers can be forgiven for feeling relatively safe in their jobs and looking forward to rising wages, as reflected in high Conference Board consumer confidence readings:

Source: Yardeni.com

Source: Yardeni.com

In summary, sustained strong improvements in employment have finally overcome the consumer caution that lingered for so long from the financial crisis.  These developments seem likely to enhance current positive economic conditions in the near future, and therefore contribute to the ongoing low volatility equity market.

Huygens equity market stress indicator continues to maintain bullish positioning in strong bull market conditions

There are many ways in which the second quarter of 2017 was unusual for U.S equity markets, especially with regards to market volatility. 

Recall that the VIX index reflects a normalized price being paid by investors for protection against downside movements in the S&P 500 index.  Lower readings of the VIX imply relatively low demand by investors for this protection.  VIX closing levels below 10.0 have been exceedingly rare:  over a 27 year period  (January 1, 1990 through April 30, 2017) there were only ten days on which VIX closed below 10.0, the most recent being in January of 2007, well before the Global Financial Crisis erupted. 

Then, in May and June of 2017, the VIX index closed below 10.0 on seven additional trading days and averaged 10.69, the lowest 2-month average level in its 27-year history.   Equity market behavior has for now justified such low demand for protection:  The S&P 500’s peak-to-trough range (one measure of realized volatility) in the month of June was the narrowest it has been since the 1960s.

Source: Yardeni.com

Source: Yardeni.com

One possible explanation for such investor confidence toward U.S. equities is that the S&P 500 appears to have genuinely emerged from its earnings recession of 2015 and 2016.  The above chart shows that operating profit per share, and management expectations for earnings per share, declined significantly in 2015 & 16.  That trend has now reversed, and if the current profit cycle follows the pattern of past cycles, there is the potential for several more quarters of S&P 500 profit growth ahead.

Source: National Federation of Independent Business (NFIB)

Source: National Federation of Independent Business (NFIB)

The National Federation of Independent Business, a trade organization for small U.S. businesses, publishes the above small business optimism diffusion index.  It combines quantitative measures, such as changes in small business inventories and job openings, with responses to survey questions such as expectations for future revenue growth.  The index remains near the historically high levels it reached immediately after the presidential election, signaling a sustained level of economic optimism not present in U.S. small businesses for over a decade.

Such optimism, low equity volatility, and low fear of volatility, might be taken as a signal of investor complacency and an early-warning sign of a market top. A risk-averse investor might seek to take profits in such conditions. Our analyses of the historical VIX index and equity market data going back to 1990 have shown us that the best approach to such low volatility regimes is to maintain exposure to equities. Our indicator system has done just that in 2017, driving steady positive returns for our strategies and for our clients.

Huygens equity market stress indicator maintains bullish positioning amid accelerating earnings growth, protecting against behavioral response to alarming headlines

The first quarter of 2017 saw a steady stream of unsettling domestic and international news.  An investor observing this would have likely expected much worse equity market volatility than was experienced, and might have been tempted to entirely avoid exposure to the equity market.  However equity market volatility was at very low levels - the S&P 500 Index went 55 straight trading days without a 1% or greater move in either direction, and the VIX index averaged 11.7 in the quarter, the lowest first-quarter average on record going back to 1990.   Protection against the behavioral tendency to react to news flow is one of the main benefits our system is designed to provide.   Our signal remained in the ‘offense’ state throughout the quarter.

Source: NFIB

Source: NFIB

Despite all the disquieting headlines, equities are currently being supported by many positive factors: S&P 500 earnings are strongly growing again after declining for several straight quarters; the Federal Reserve is raising interest rates at a measured pace, comforting investors that no surprise moves are in store while simultaneously encouraging portfolio rebalancing away from bonds and into equities.  Perhaps one of the strongest factors supporting equities is sentiment.  The above chart from the NFIB, a trade association for small businesses, shows the recent dramatic rise in small business optimism, likely responding to the current administration’s aggressive pursuit of a pro-growth agenda.

A nervous investor could be forgiven for feeling pessimism, however.  The U.S. manufacturing sector continues to stagnate, with production volume remaining essentially flat for the past five years at a level equal to that first reached in 2004, and well below the peak level reached in 2007.

Source: Yardeni.com

Source: Yardeni.com

Meanwhile global debt as a percent of GDP has continued its rise and now exceeds levels seen in the depths of the financial crisis.

Source: International Monetary Fund

Source: International Monetary Fund

Perhaps most concerning is a recent steep decline in the growth rate of U.S. bank lending.  The causes for it are unclear, but its coincidence with the Federal Reserve’s positioning on interest rates in late 2016 is uncanny.  If the decline continues it signals the exact sort of credit market tightening that has contributed to past recessions.

Source: Wall Street Journal

Source: Wall Street Journal

While certain economic indicators are promising and business is feeling optimistic about growth prospects, not every indicator is positive and some are downright worrisome.  Our economy and equity markets have been particularly perplexing and difficult to analyze since the financial crisis, to say the least.  It is for confusing times like these that we developed our investment system.

Introducing our dynamic derivatives portfolios for high net worth and institutional clients

Our Titan and Sidereal strategies generate returns by tactically harvesting the equity Volatility Risk Premium (“VRP”).  The VRP, in simple terms, is a measure of the extra price investors are willing to pay for protection against equity market losses, as compared to the price a rational investor with perfect information would pay.   The difference is positive most of the time – in other words, investors are generally willing to overpay for insurance against losses.  Our system is designed to capture this premium only during times when the probability of an abnormal equity market drawdown is low.  If our system determines the likelihood of an equity drawdown is unacceptably high, we move our client assets to cash the next day and wait for our system to indicate that conditions have turned more favorable. 

To harvest the VRP, both strategies will hold a short position in VIX futures contracts (or an ETF containing these contracts). These contracts are typically priced above the current (or "spot") level of the VIX index, with the difference reflecting, in part, the VRP.As time passes and the contracts approach maturity, their price must converge with the spot VIX index.If forecasted volatility does not appear, the futures contracts prices will fall to meet the spot level, and our clients will benefit.

VIX roll down chart.png

The above chart illustrates this process for the August 2016 futures contract.  As of July 20, 2016, the spot VIX Index was priced at 11.8 and the August 2016-expiry VIX Futures contract was priced at 15.5.  This price difference reflects, in part, the VRP investors were willing to pay for equity drawdown protection in the summer of 2016.  The chart shows the declining price of this contract each week, as equity market volatility failed to materialize.  Eventually on August 17, the contract matured at a price equal to the spot VIX index at the time.  Investors who shorted this futures contract on July 20 earned 2.7 points (from 15.5 to 12.8), or 17%, in the 21-day period from July 20 to August 17.

Of course, the performance of this approach will vary over time.  The summer 2016 data, while better than the average month, are not uncommon.  Bull and sideways equity markets generally present opportunities to harvest VRP, as do the recovery phases of bear markets.  Attempting to harvest VRP should be avoided during the onset of an equity correction or bear market.  The discernment of better or worse conditions for VRP harvesting is the core of Huygens’s tactical system that drives our strategies. 

We designed our system in 2016, after spending two years reviewing academic research and experimenting with live trades.  We studied 11 years of daily market data and examined our system’s hypothetical responses to it.  Over this time frame, in hypothetical tests our system recommended having exposure to the VRP-harvesting position 45% of trading days, and remaining in cash 55% of days.

Our Titan strategy is the purest expression of this approach; the Sidereal strategy combines it in a portfolio with a long position in 10-year treasuries, trading some potential absolute return for potentially more stable portfolio returns.

Huygens equity market stress indicator quickly returns to bullish positioning despite noise and confusion surrounding presidential election

The weeks since early November 2016 are emblematic of a period when a quantitative indicator of true stock market stress can be most helpful to protect investors from their psychological biases.  You may recall that many respectable economists predicted severe and immediate financial market panic if Donald Trump won.  

On election night, at roughly 2:30 AM when Fox News first called the election for Donald Trump, Walt received a call from a close friend (who is however not a Huygens client).  “Is there any way I can sell all my mutual funds before the market opens tomorrow?” he asked.  At the time of that phone call, U.S. equity index futures were dropping precipitously.   

The panic quickly subsided. Within a day of the election, our market stress indicator turned offensive and has stayed in that state ever since, and as a result our strategies have captured much of the ensuing strong equity market run. An individual’s natural response would have been to expect volatility to resume, and therefore to wait on the sidelines for a better market entry point. Our system recommended otherwise, to our clients’ benefit.

Earlier in 2016, we pointed out that equity market stress, as measured by rolling 12-month volatility of daily returns, has been continuing its long decline from the 2008-9 global financial crisis, despite having reached a recent minor peak in February of 2016.  The Kansas City Federal Reserve Bank’s index of financial market stress, which combines measures of stress in multiple financial markets including equity, debt, and foreign exchange markets, illustrates this well:

KC Fed stress index.png

Huygens market stress indicator correctly maintained bullish positioning in the quarter & captured stocks' gains, at a time when recession seemed imminent but never arrived.

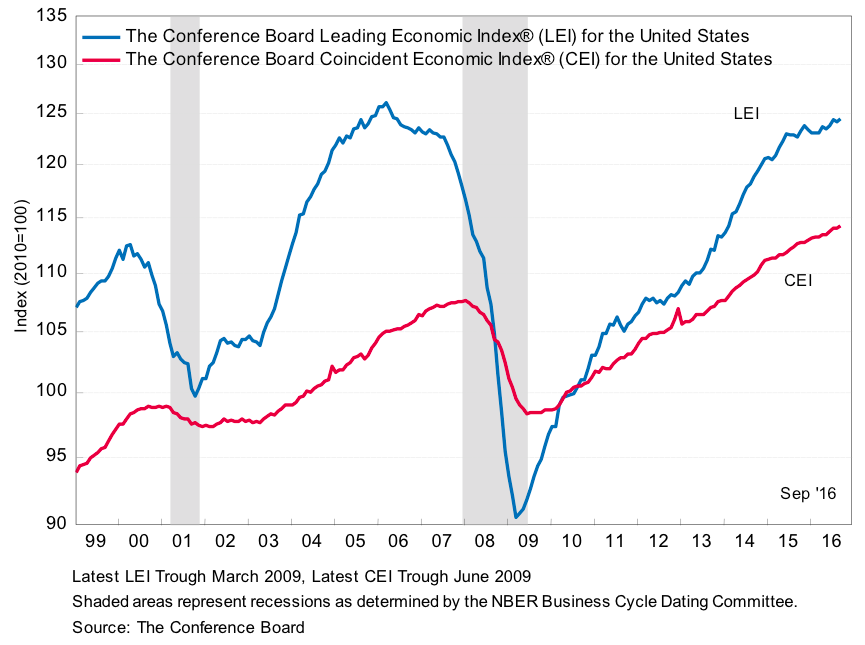
Despite current jitters over the upcoming elections, the U.S. economy continues to improve, albeit slowly.  The Conference Board’s Leading and Coincident Economic Indicator Indices both signal that a downturn in economic activity has not yet arrived.

Source: The Conference Board

Source: The Conference Board

At the core of our strategies is a system for determining when to have offensive or defensive exposure to U.S. equities.  While there is certainly benefit to a system that can move to a defensive position before an equity market selloff has reached its bottom, it can be equally beneficial for that system to maintain an offensive positioning when emotions might otherwise lead a human investor to play it safe.  Thus our system has maintained its offensive positioning for all but four trading days this year, capturing the Russell 2000’s strong recovery since February.

In past client notes we have commented on our study of regimes in financial market behavior.  The below chart graphs rolling 12-month standard deviation of daily returns to illustrate long-term behavioral regimes in the U.S. large-cap equity market.  Volatility has been in a continued decline since the 2008-9 financial crisis.  Recent bursts of volatility in 2015 and early 2016 were driven mostly by fears of aggressive central bank tightening, not by true underlying economic weakness.  Now that the tightening has not materialized, volatility has resumed its long, slow decline.

S&P realized vol.png

As you know, the Huygens Market Stress Indicator system monitors equity market volatility daily in order to react to any sudden and severe changes in equity market sentiment. The general lack of change in our system’s positioning in 2016 seems consistent with the ongoing (if slow-moving) economic recovery, and the large-scale decline in equity market volatility.

Like you, we wait with some anxiety to see what early November brings.Regardless, we continue to monitor equity market stress daily and react accordingly.

Huygens market stress indicator correctly stayed bullish at quarter end as US Central Bank interest rate stimulus cushioned US stocks against Brexit volatility and ongoing earnings softness

The story of the quarter is straightforward.  In our previous two client notes, we noted the marked underperformance of the Russell 2000 small cap index relative to the S&P 500, but commented in our Q1 2016 note that the worst of this divergence was likely over.  We pointed out that it was driven by two factors: the Russell 2000’s overexposure to energy, and the S&P 500’s overexposure to corporate buybacks.  With oil prices recovering and stabilizing since February 2016, and with the volume of corporate buybacks declining in 2016, the Russell 2000 outperformed the S&P 500 by 6% off the early February bottom.  See the chart below.

Russell SPLV SP500 chart.png

In addition, the S&P large cap low-volatility index also outperformed the S&P 500.  This index tends to overweight high dividend-paying stocks.  At the start of 2016, the U.S. Federal Reserve Bank (FRB) had signaled it would likely increase interest rates 4 times in the year, but several indicators of economic growth, including inflation, job creation, and wage growth, were low enough to force the FRB to reconsider.  Its current messaging is that it may only raise interest rates once or twice, and as a result dividend-paying stocks have outperformed the broader index.

We finally also note the very brief burst of volatility surrounding the UK’s decision to leave the EU.  Our market stress indicator correctly remained offensive during the whole episode, and equity market performance quickly validated that call.

In sum, several things went our way this quarter.