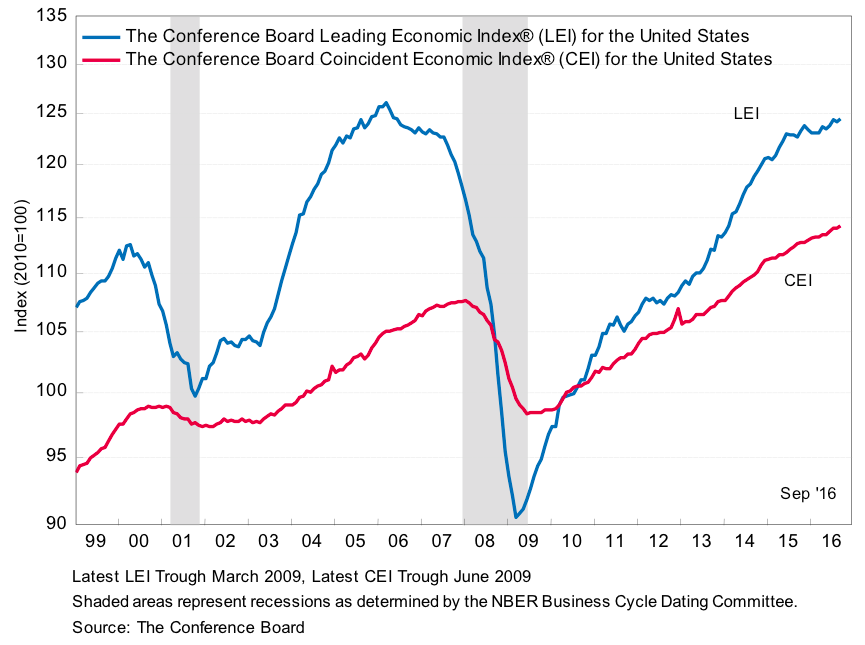
Despite current jitters over the upcoming elections, the U.S. economy continues to improve, albeit slowly. The Conference Board’s Leading and Coincident Economic Indicator Indices both signal that a downturn in economic activity has not yet arrived.
Source: The Conference Board
At the core of our strategies is a system for determining when to have offensive or defensive exposure to U.S. equities. While there is certainly benefit to a system that can move to a defensive position before an equity market selloff has reached its bottom, it can be equally beneficial for that system to maintain an offensive positioning when emotions might otherwise lead a human investor to play it safe. Thus our system has maintained its offensive positioning for all but four trading days this year, capturing the Russell 2000’s strong recovery since February.
In past client notes we have commented on our study of regimes in financial market behavior. The below chart graphs rolling 12-month standard deviation of daily returns to illustrate long-term behavioral regimes in the U.S. large-cap equity market. Volatility has been in a continued decline since the 2008-9 financial crisis. Recent bursts of volatility in 2015 and early 2016 were driven mostly by fears of aggressive central bank tightening, not by true underlying economic weakness. Now that the tightening has not materialized, volatility has resumed its long, slow decline.
As you know, the Huygens Market Stress Indicator system monitors equity market volatility daily in order to react to any sudden and severe changes in equity market sentiment. The general lack of change in our system’s positioning in 2016 seems consistent with the ongoing (if slow-moving) economic recovery, and the large-scale decline in equity market volatility.
Like you, we wait with some anxiety to see what early November brings.Regardless, we continue to monitor equity market stress daily and react accordingly.

